Prode Properties
Fluid Properties in Excel, MATLAB, Python, MathCad...
Title : Fluid Properties in Excel, MATLAB, Python, MathCad...


Contact Prode
Fluid properties, pure fluids and mixtures in Excel, NET, MATLAB, Python, Mathcad...
Prode Properties Editor
There are different versions of Prode Properties for Windows, Linux, Android, macOS, all these include a graphical editor which shows the same interface in all systems (except for small differences due to different fonts)
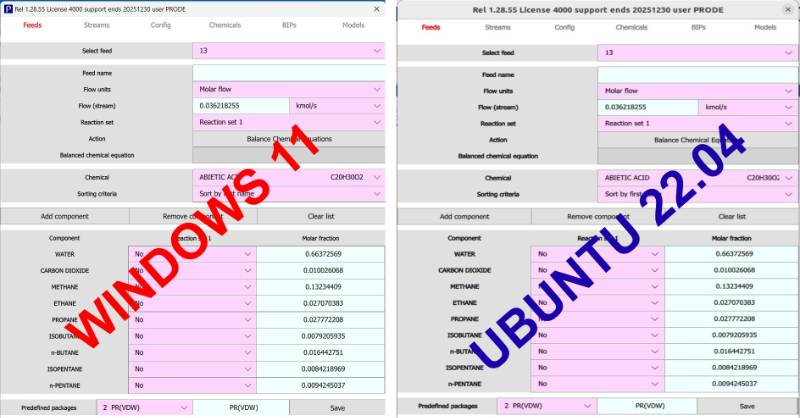
From Prode Properties editor the user can define streams (Prode allows to define 50 or more streams each including the lists of components, models, reactions..), define units of measurement and settings, solve unit operations, regress VLE/LLE/SLE and raw data, edit data in Prode Properties archives to modify existing components or add new components...
Note : all these operations are possible also with code-based procedures.
Fluid Properties in Excel
When introduced in 1993 Prode Properties was the first thermodynamic framework (C++ native library) designed to provide advanced features (those available at that time in large and complex tools as the process simulators) within common applications as Lotus 1-2-3, Microsoft Excel, MATLAB...
Prode library includes a complete set of solvers to calculate the properties of pure fluids and mixtures, solve multiphase equilibria (including solid, hydrates, asphaltenes...), multiphase flow, phase envelopes / phase diagrams, distillations and many other unit operations ...
With native C++ support for multiple threads and operating systems Prode library represents the best solution when a compact library which integrates directly with your preferred tools is preferable over indipendent, complex aplications difficult to connect...
Prode library connects directly with Excel (it works as Excel add-in) allowing to solve complex problems from Excel or similar tools..
Connect Prode Properties with Excel
The library connects Excel as standard add-in, once installed the methods in Prode library are accessible as Excel macros and an additional menu is visible on Excel ribbon.
Calculate Fluid Properties in Excel and create charts and graphs
Prode library includes many predefined examples (Excel pages) useful to print phase diagrams, solve unit operations as distillations, safety valves, exchangers, compressors / expanders etc.
From Excel menu File->open , in Excel folder (in Prode Properties installation) select the file props.xls this Excel page allows to graph tables of values in a range of temperatures for many different properties (liquid fraction, cp, cv, density, viscosity, thermal conductivity, speed of sound) for both gas and liquid phases
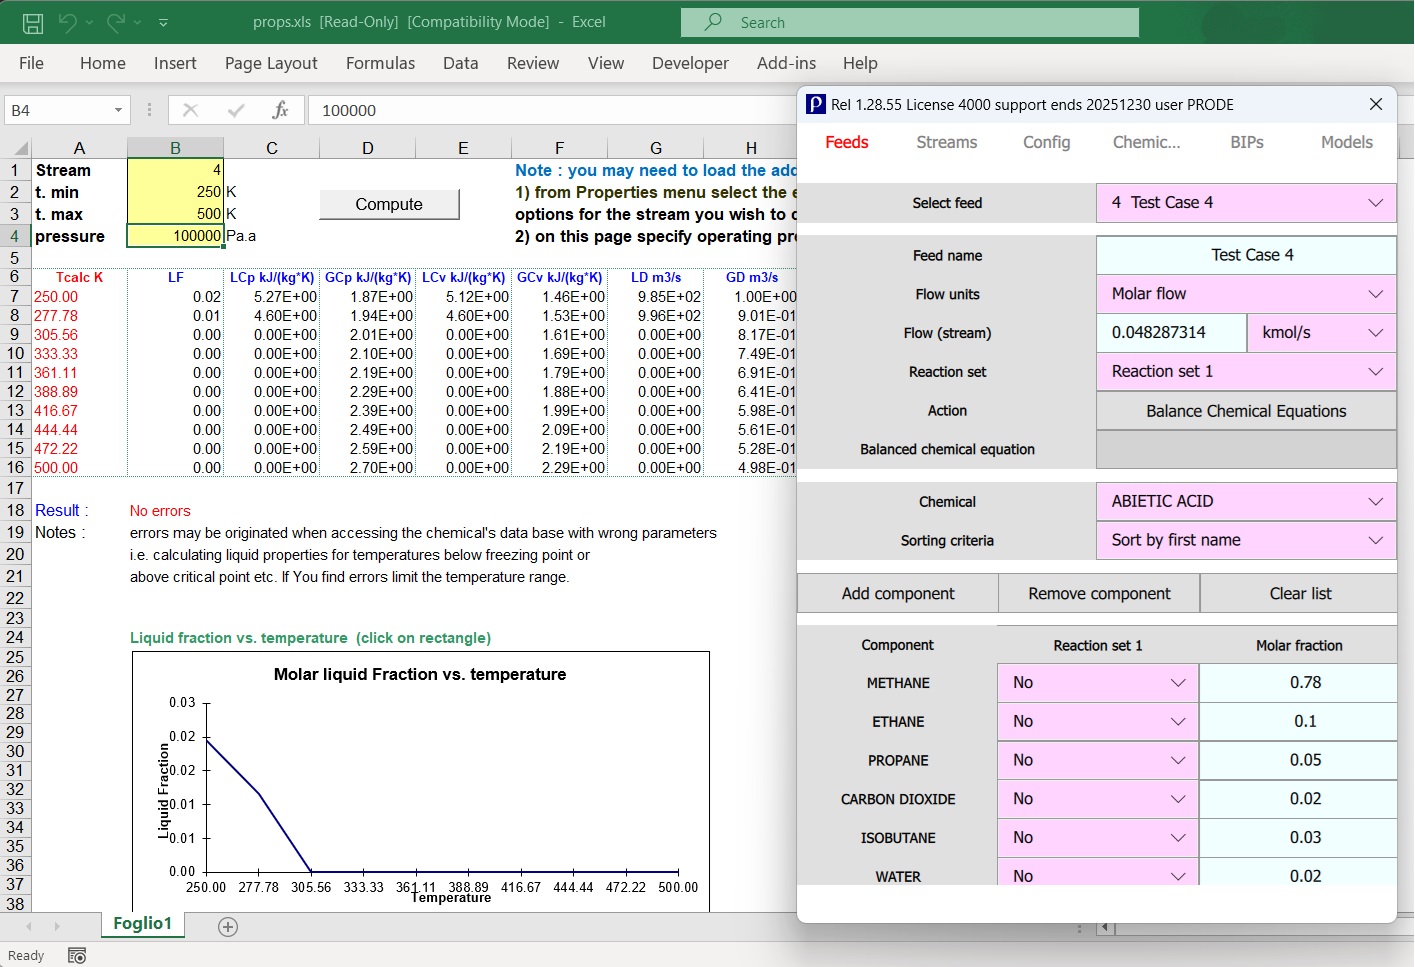
Prode Editor allows to modify stream's compositions, models and the units of measurement.
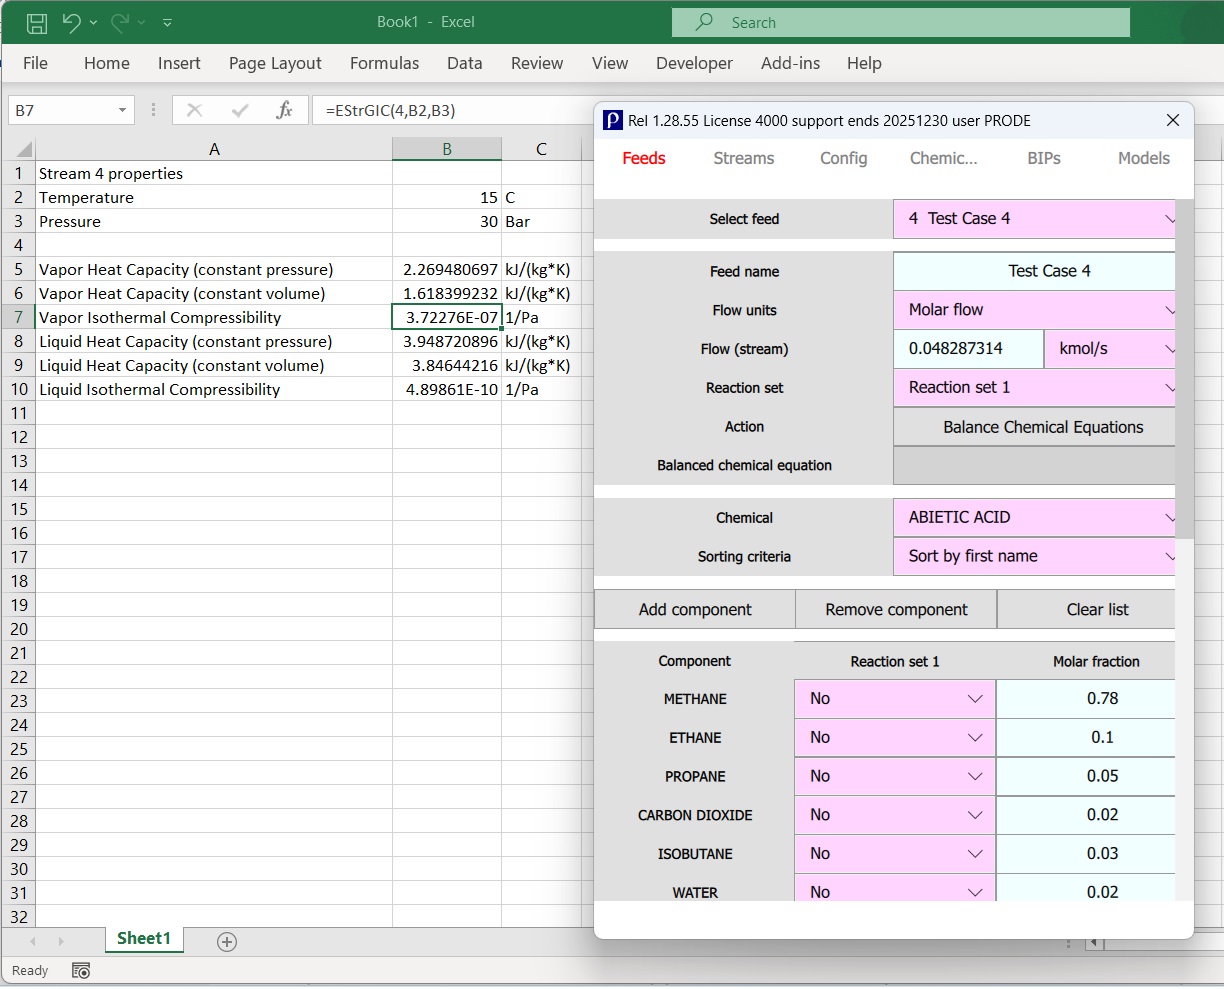
Conversely, you can obtain the same values directly in Excel cells through the macros exported by Prode Propeeties...in this case (see below) when the user modifies the values of temperature or pressure (cells $B2 and $B3) Excel shows automatically the new values for vapor and liquid phases (heat capacities at constant pressure and volume plus isothermal compressibility) calculated by Prode library for stream 4 at the specified conditions.
Another possibility to connect Prode Properties with Excel is through NET code.
Fluid Properties in NET 9
Prode Properties works (as native C++ library) in Windows, Linux, Android, macOS , the distribution includes application examples for NET 9 showing how to access Prode library from NET 9 Multi-platform App UI (NET MAUI) which works in Windows, Linux and macOS
Note that you need different versions of the Prode library to work on different systems.
Fluid Properties in MATLAB
MATLAB can connect Prode Properties in different ways :
- running Prode Properties from MATLAB commad window
- via Python wrapper (Python required)
- linking Prode library to MATLAB code
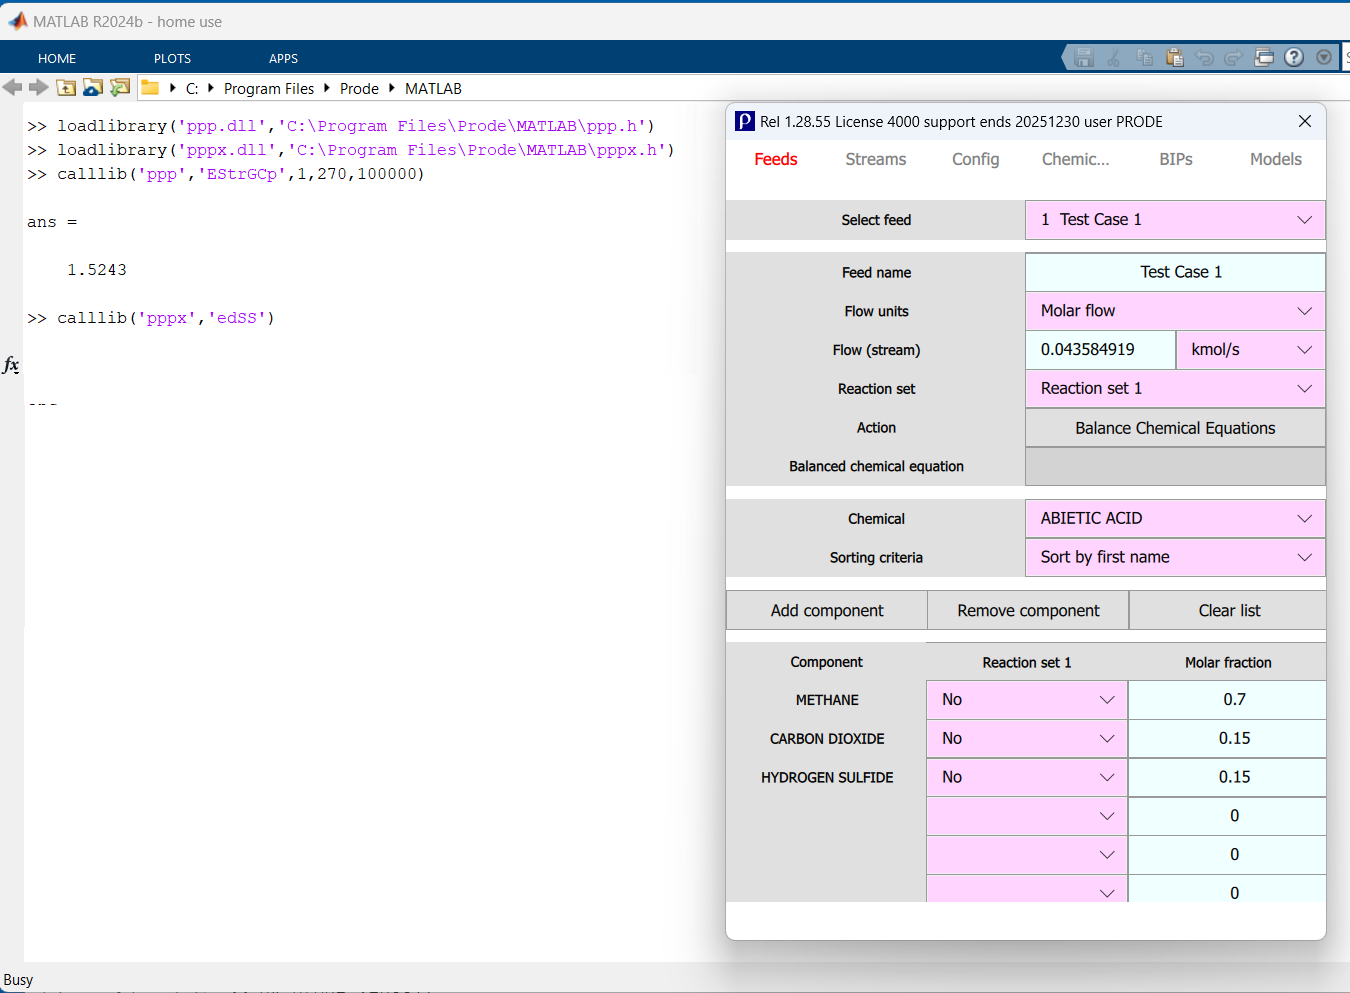
When running Prode library from MATLAB command window you first load the libraries with the command loadlibrary, then all the methods exported by Prode library are accessible from MATLAB, this example shows the value calculated by EStrGCp at specified conditions for stream 1 :
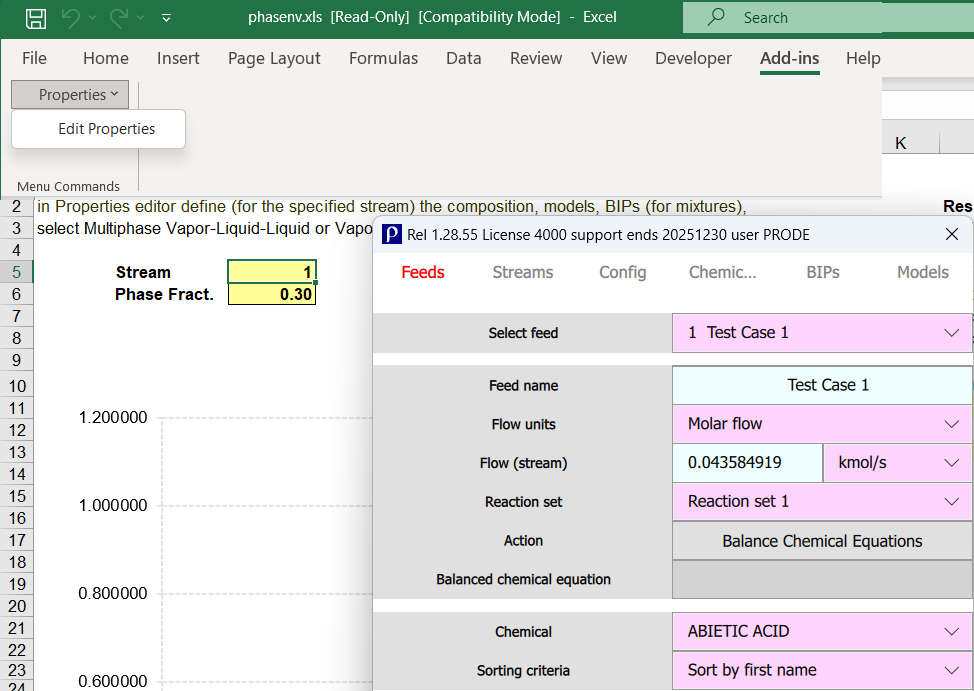
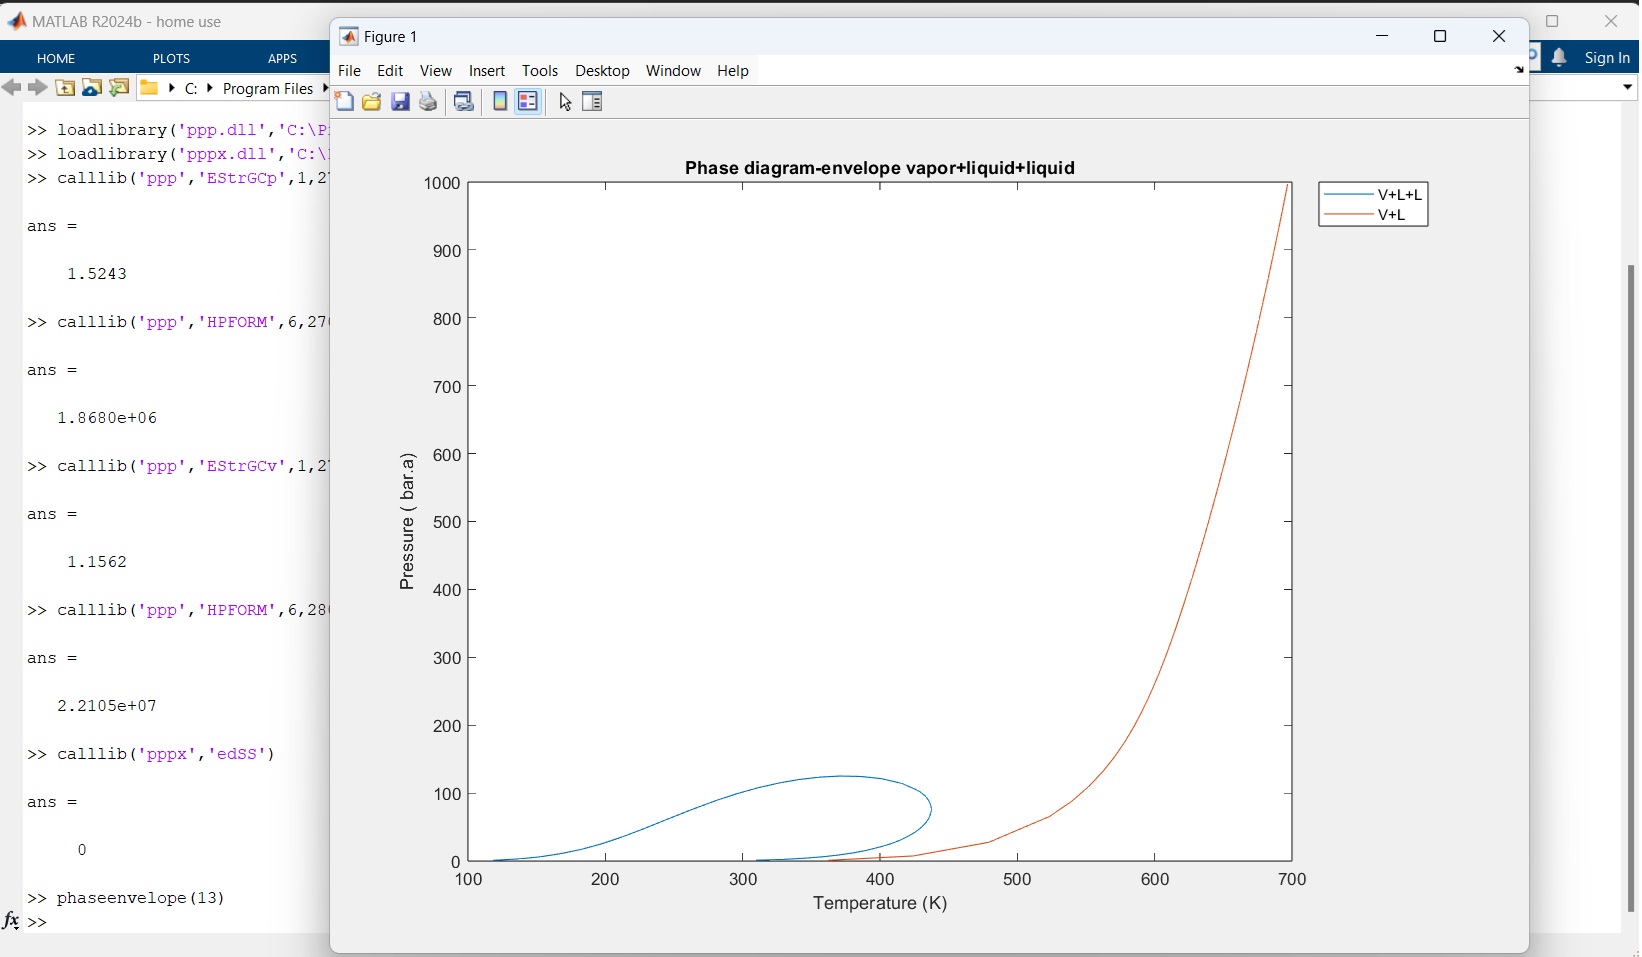
As alternative one can create a MATLAB script (in this case phaseenvelope.m included in distribution) to execute several steps in sequence, this example shows a Vapor + Liquid + Liquid P-T phase diagram calculated for stream 13 which contains a large fraction of water :
Fluid Properties in Python
Python can connect Prode Properties (a native C/C++ library) in different ways :
- with the predefined wrappers included with Prode distribution
- compiling and linking your code to Prode library through Python libraries as ctypes...
- through other tools
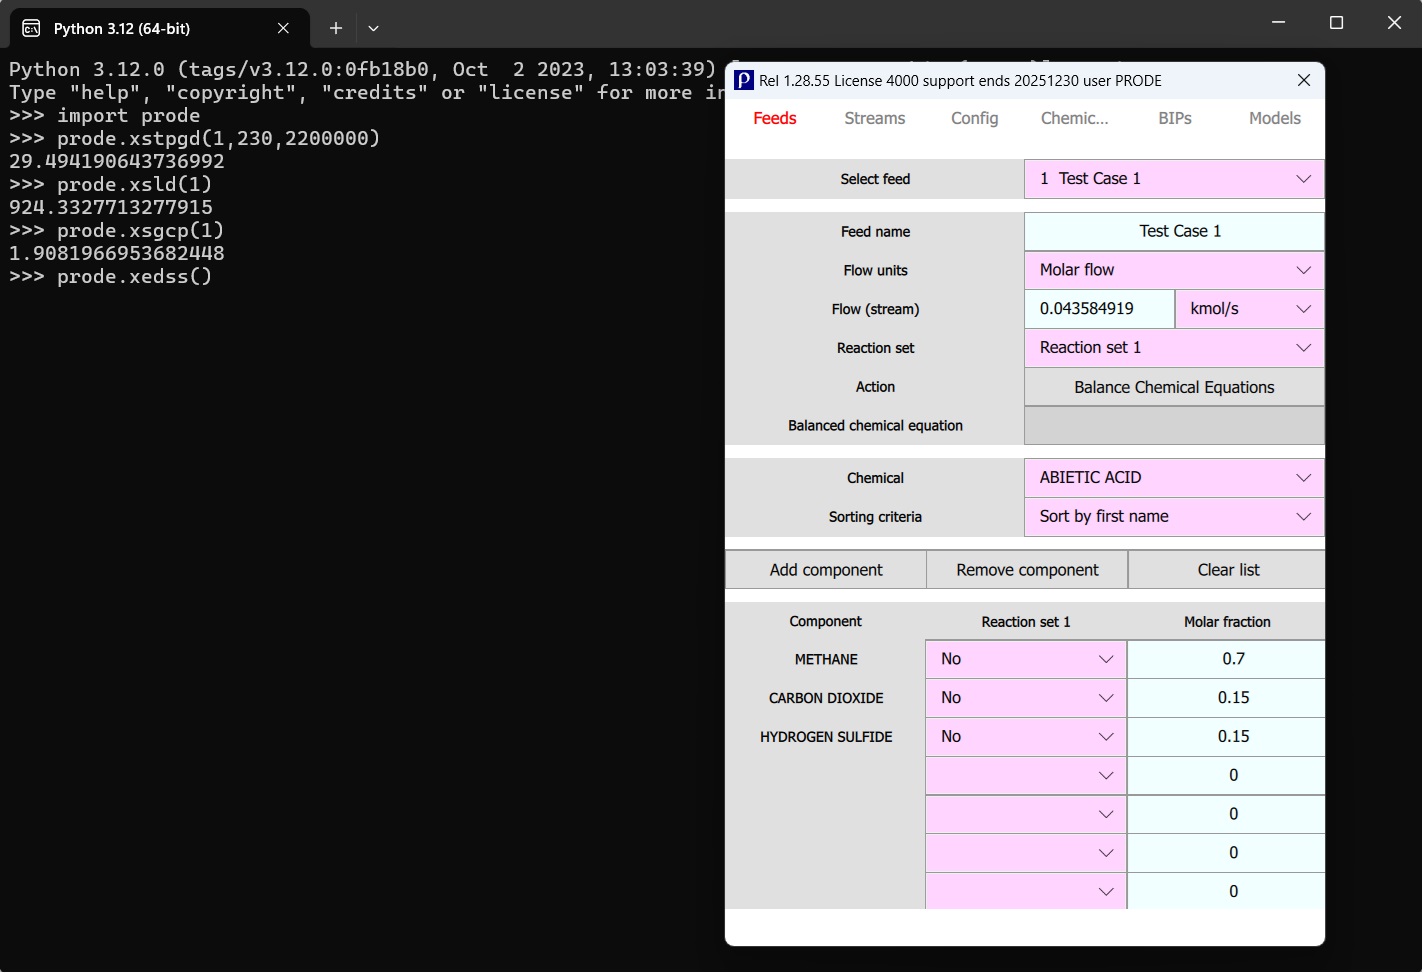
With the predefined wrappers, when running Prode library from Python command window you first load the library with the command import prode, then all the methods exported by Prode library are accessible from Python, you can for example, obtain the values of liquid densities or vapor heat capacities at specified conditions :
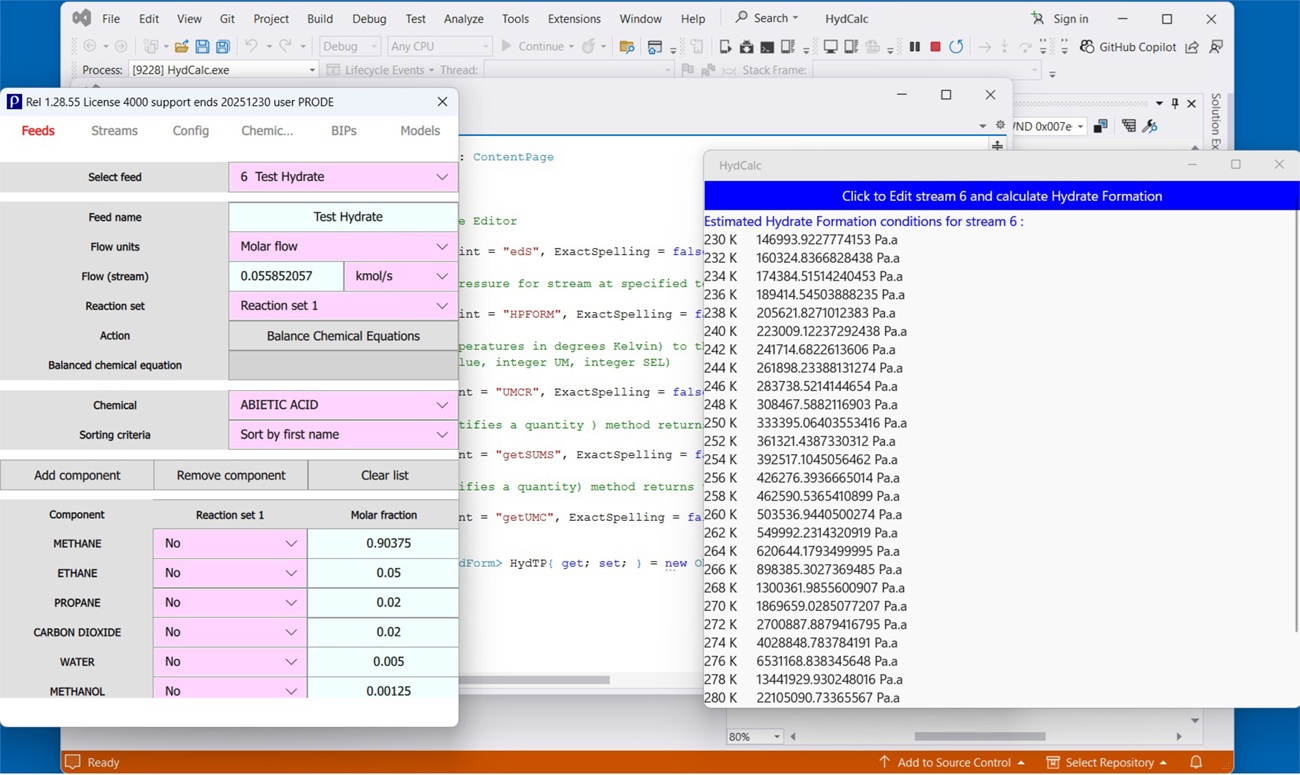
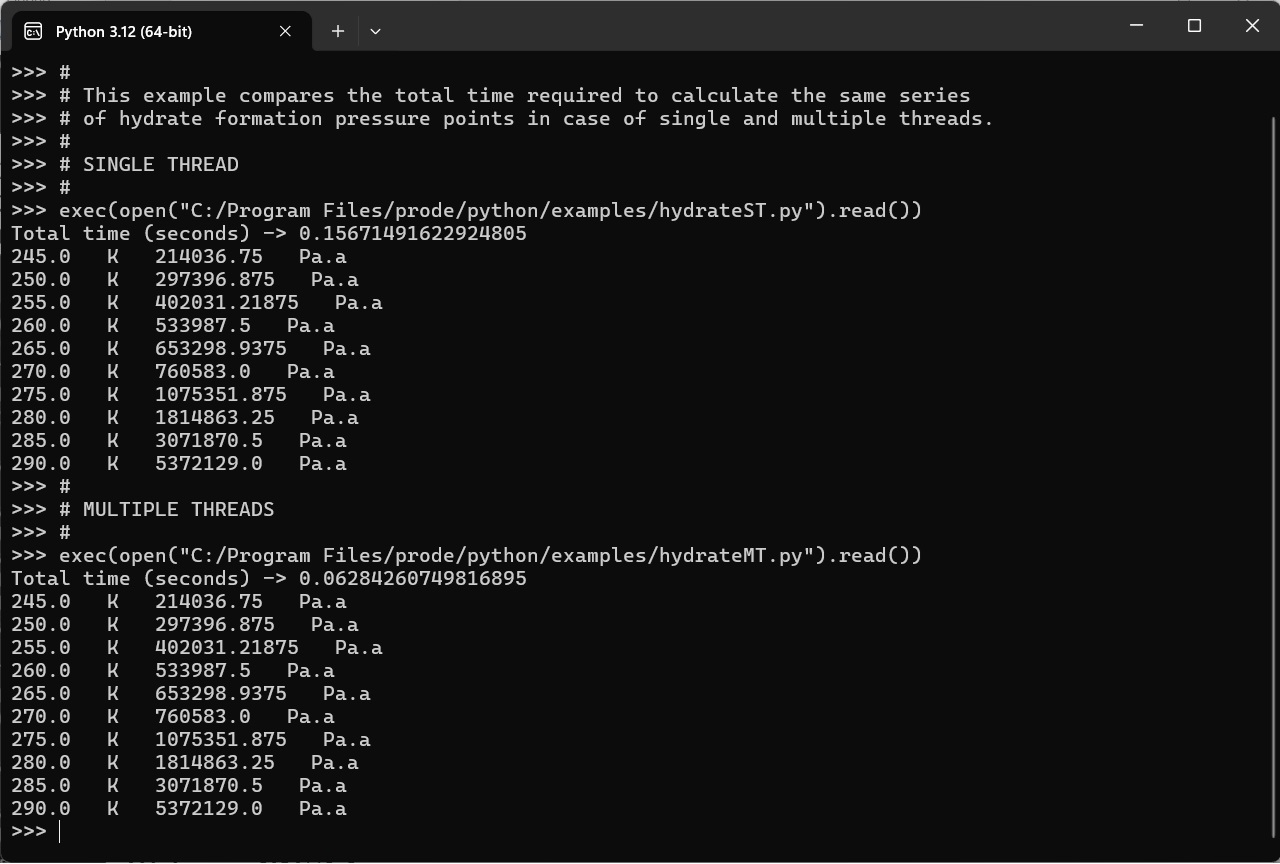
Since both Python and Prode library support multiple threads (concurrent execution of multiple threads within a single process) one can compare the total time required to calculate the same series of hydrate formation pressure points in case of single and multiple threads as with this example included in Prode distribution :
In the same way you can create graphs, optimize process units, identify optimal solutions etc.
Herebelow a short list of fluid properties which can be calculated with Prode library :
- Phase fraction (vapor, liquid, solid)
- (True) critical point pressure of mixtures
- (True) critical point temperature of mixtures
- Cricondentherm temperature of mixtures
- Cricondentherm pressure of mixtures
- CricondenBar temperature of mixtures
- CricondenBar pressure of mixtures
- Cloud point temperature of mixtures
- Cloud point pressure of mixtures
- Flash point of flammable mixtures
- Enthalpy of gas / vapor phase
- Enthalpy of liquid phase
- Enthalpy of solid phase
- Entropy of gas / vapor phase
- Entropy of liquid phase
- Entropy of solid phase
- Density of gas / vapor phase
- Density of liquid phase
- Density of solid phase
- Isobaric specific heat (Cp) of gas / vapor phase
- Isobaric specific heat (Cp) of liquid phase
- Isochoric specific heat (Cv) of gas / vapor phase
- Isochoric specific heat (Cv) of liquid phase
- Gas heating value
- Gas Specific gravity
- Joule Thomson coefficients of gas / vapor phase
- Joule Thomson coefficients of liquid phase
- Isothermal compressibility of gas / vapor phase
- Isothermal compressibility of liquid phase
- Volumetric expansivity of gas / vapor phase
- Volumetric expansivity of liquid phase
- Speed of sound in gas / vapor phase
- Speed of sound in liquid phase
- Speed of sound in gas+liquid (mixed) phase
- Viscosity of gas / vapor phase
- Viscosity of liquid phase
- Thermal conductivity of gas / vapor phase
- Thermal conductivity of liquid phase
- liquid Surface tension